

.NET Core Tip 3: Troubleshooting Memory Leaks within a .NET Console application running in Kubernetes with PerfViewer
How to fix the memory leak in the .NET Core application running within a linux docker container with Kubernetes with PerfViewer?


In the previous article, we saw how to get the dump files to help us spotting the memory leak in our application.
Today we will see how to use the dump files.
We will use:
- PerfView: a free performance-analysis tool that helps isolate CPU and memory-related performance issues. It was for the Windows OS in the past, but now it handles analyzing data collected on Linux machines !
First let's see how to use PerfView!
- PerfView
First we can get the last download :
https://github.com/microsoft/perfview/blob/main/documentation/Downloading.md
We get get the very last releases:
https://github.com/Microsoft/perfview/releases
We open the PerfView application:

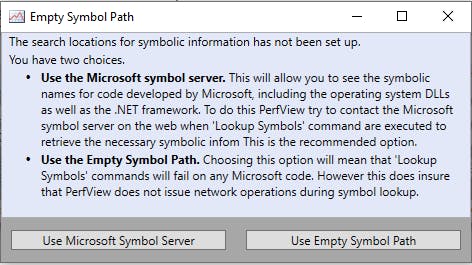
We accept the End User License Agreement (EULA).
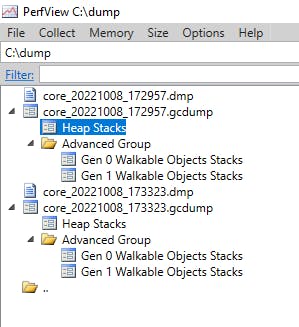
Let's open our folder with our two dump files (make sure the extension is *.dmp)
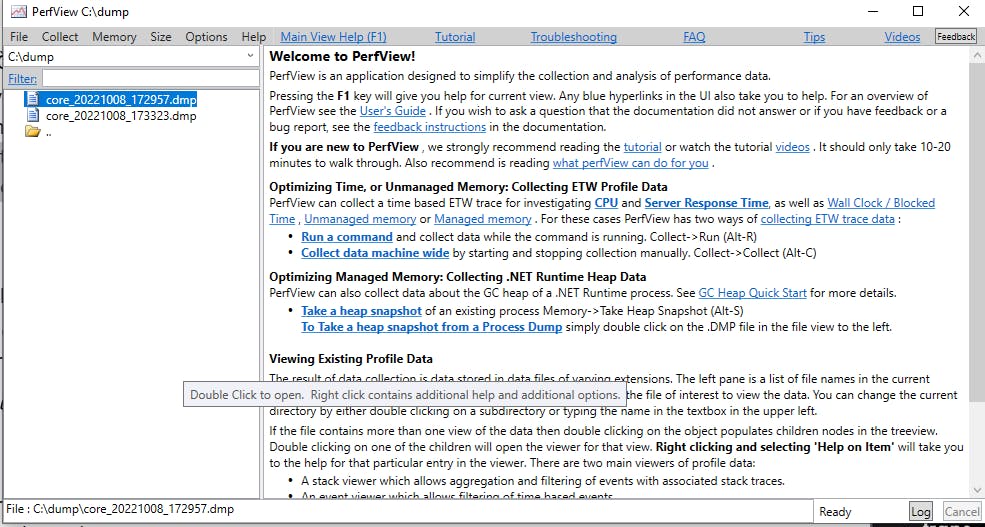
We double click our first dump file, it opens the dialog :
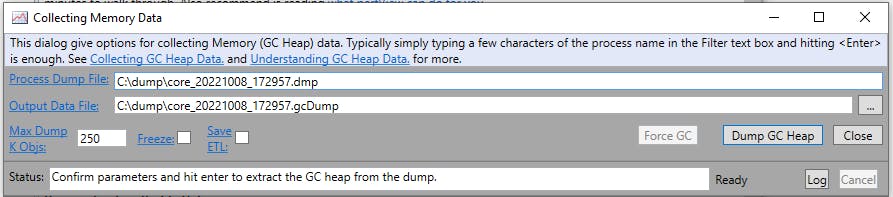
Let's click on "Dump GC Heap" button:
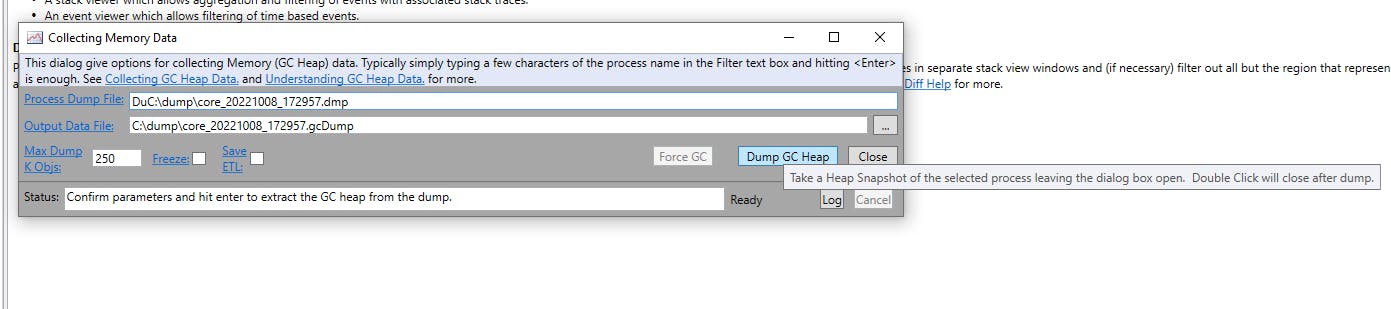
We see the following dialog:
We close it for now and let it finish.
We do again the same actions with the second dump file.
At the end we get:
Let's set now the symbol path:
Go to File > Set Symbol Path > click on Add Microsoft Symbol Server
We get:
SRVC:\Users\NBARLA~1\AppData\Local\Temp\SymbolCachemsdl.microsoft.com/download/symbols
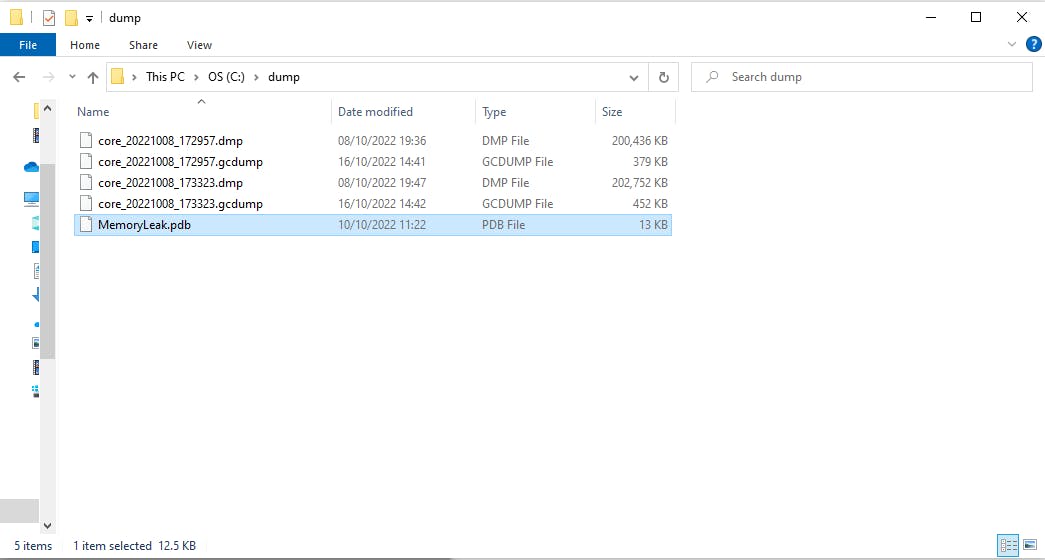
Let's copy our pdb file of our app in C:\dump
Add the path:
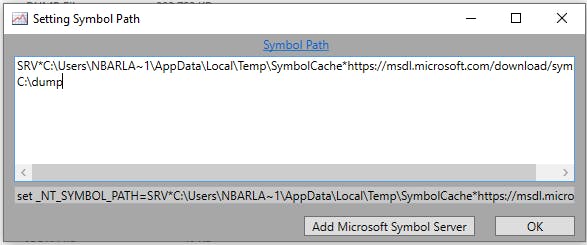
That way we get all the info about the code path.
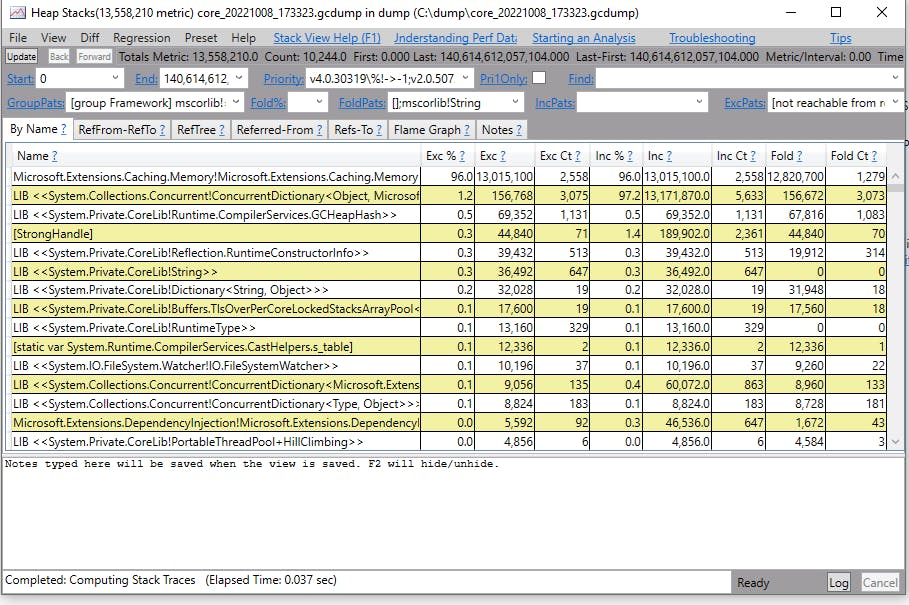
Let's open the second GC Dump files by double clicking "Heap Stack":
Let's go to the menu "Diff" > "With Baseline: Heap Stack xxxxxx"
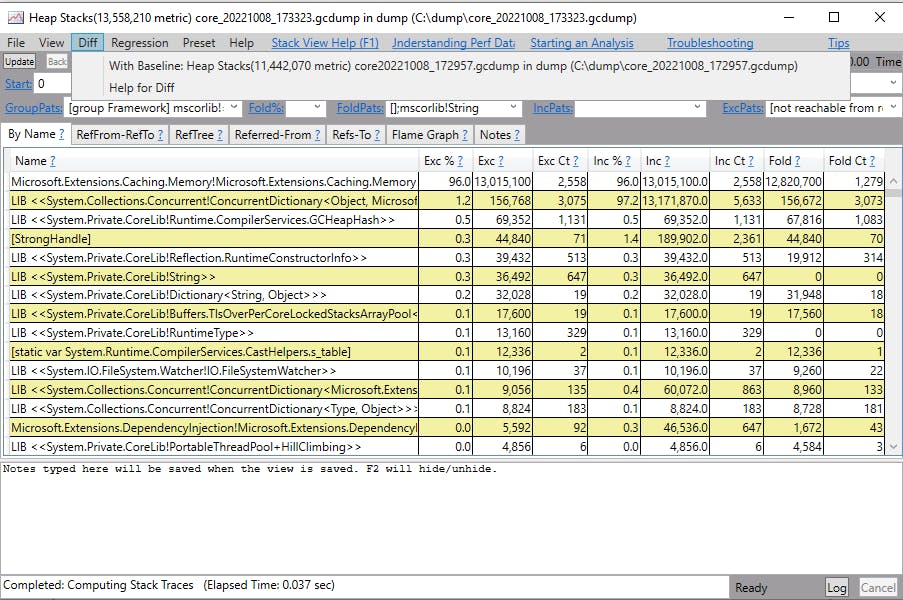
We get a new dialog "Diff Heap Stacks":
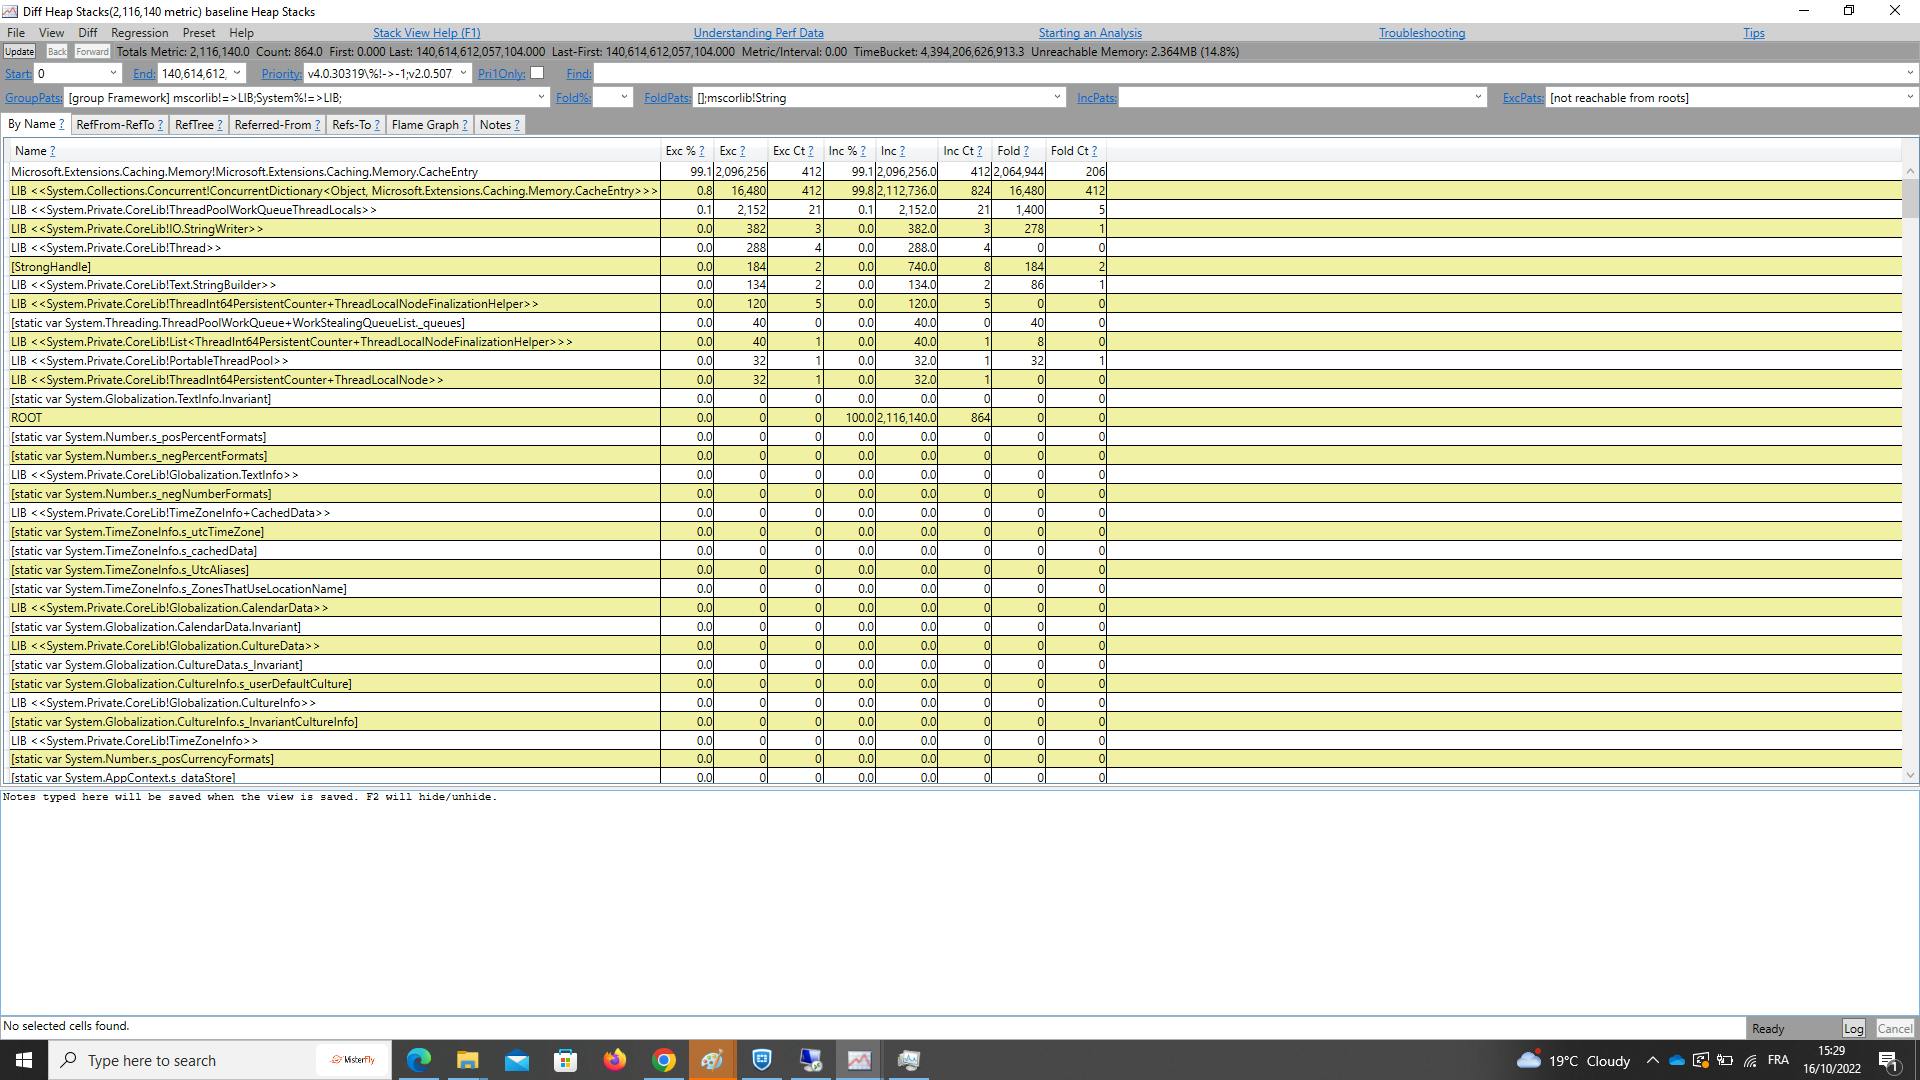
Let's focus on the Tab:
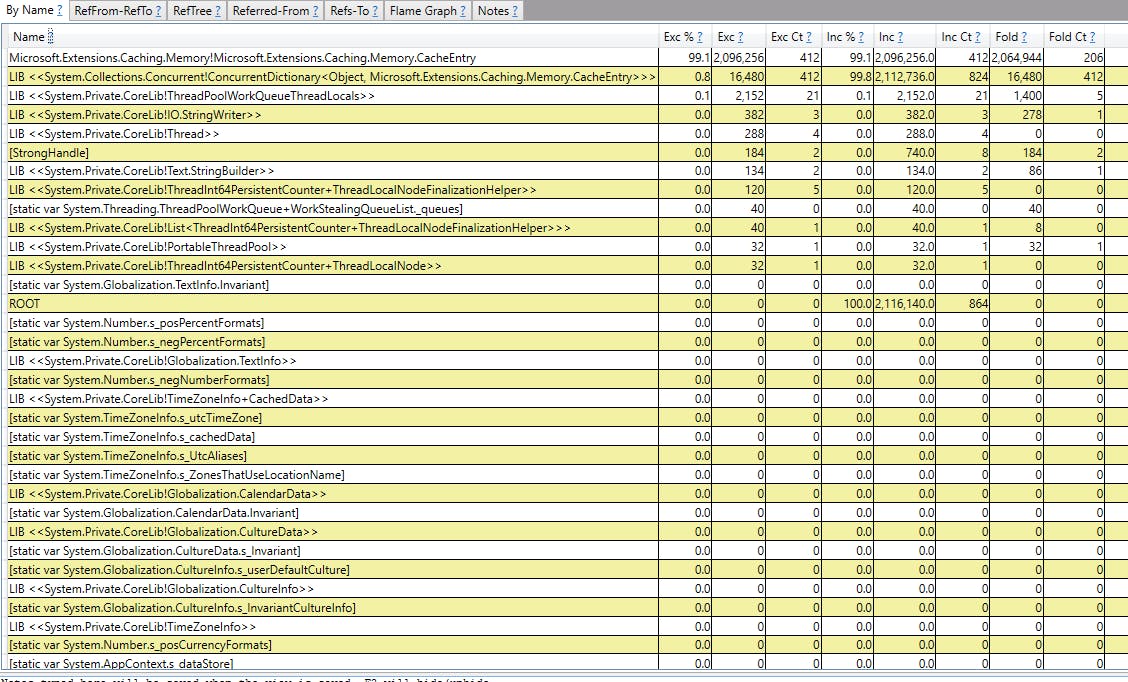
We can immediately see we have 99% of the difference within the Heap is made of the type "Microsoft.Extensions.Caching.Memory.CacheEntry". Basically 99% of the new allocations between the two dumps comes from these types.
So we should focus on these types and know where they come from! For this let's double click on the type, PerfView changes the focus to the tab "Refered-From": it is the Callers View.
Callers View
The callers view shows you all possible callers of a method. It is atreeview (like the calltree view), but the 'children' of the nodes are the'callers' of the node (thus it is 'backwards' from the calltreeview). A very common methodology is to find a node in the'byname' view that is reasonably big, look at its callers ('by doubleclicking on the entry in the byname view), and then look to see if there are bettersemantics groupings 'up the stack' that this node should be folded into.
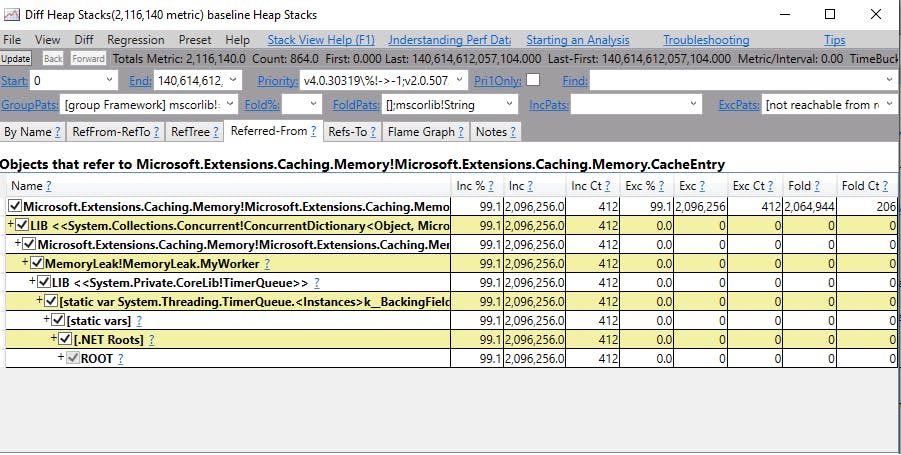
So we will read from the top to the bottom to see where the types are allocated:
At the bottom we can see "ROOT" : it is the root that the GC goes through first to find all the references to our type "Microsoft.Extensions.Caching.Memory.CacheEntry".
Just above we can see a specific type of ROOT : ".NET Roots" it is to tell use it is managed code and it is the beginning of the path which references to our "Microsoft.Extensions.Caching.Memory.CacheEntry".
Then we can see a very interresting node called "static vars": basically it is a static variable which starts our reference. Remember static variables is a type of root recognized by the GC.
Ok now we know we has a static variable what is it exactly? Well we can see it on the node above: "Static var System.Threading.TimerQueue.>
Right we will see later on what it is about. In the node above we can see "LIB System.Private.CoreLib!TimerQueue" : it is to tell use TimeQueue is in the .NET Library nothing more.
Above we can see the type : "MemoryLeak!MemoryLeak.MyWorker" : Now it looks familiar! It is our assembly "MemoryLeak" and our class "MemoryLeak.MyWorker" separated by "!".
So now we can focus on MyWorker to find our leak :)
Above we see "Microsoft.Extensions.Caching.Memory!Microsoft.Extensions.Caching.Memory.MemoryCache"
It is a field of our MyWorker of type Microsoft.Extensions.Caching.Memory.MemoryCache from the assembly Microsoft.Extensions.Caching.Memory.
Now we reach the final Type : Microsoft.Extensions.Caching.Memory.CacheEntry which explains our diff in memory.
So now we know exactly where the memory leak comes from to the following field:
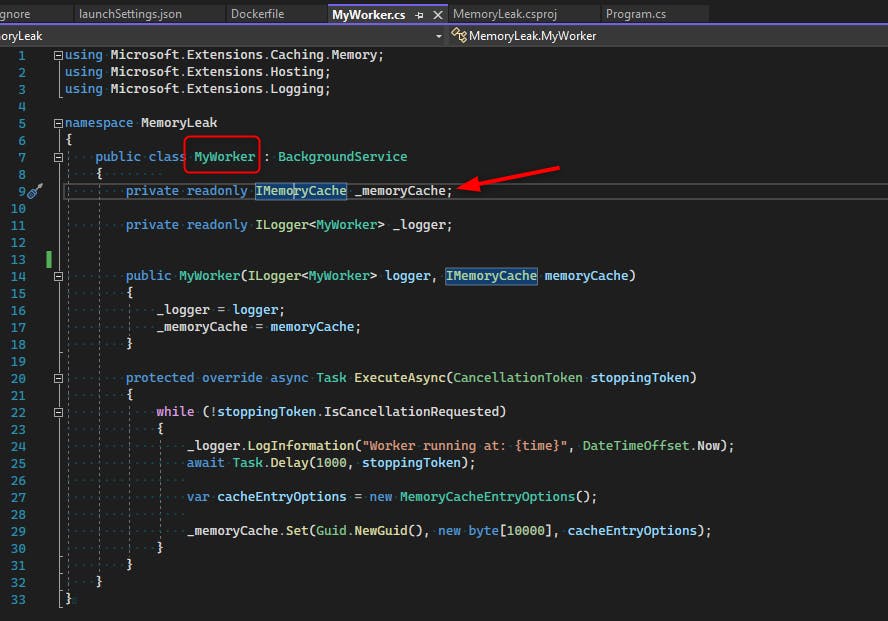
We can see one field about MemoryCache, well it is actually the interface IMemoryCache.
When we look at the implementation of the interface with we see:
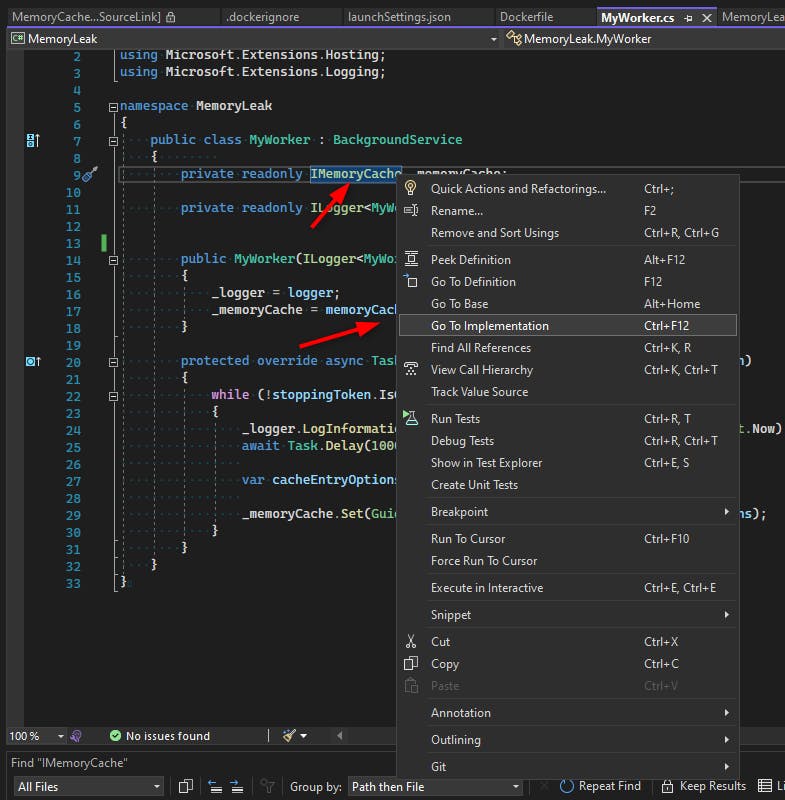
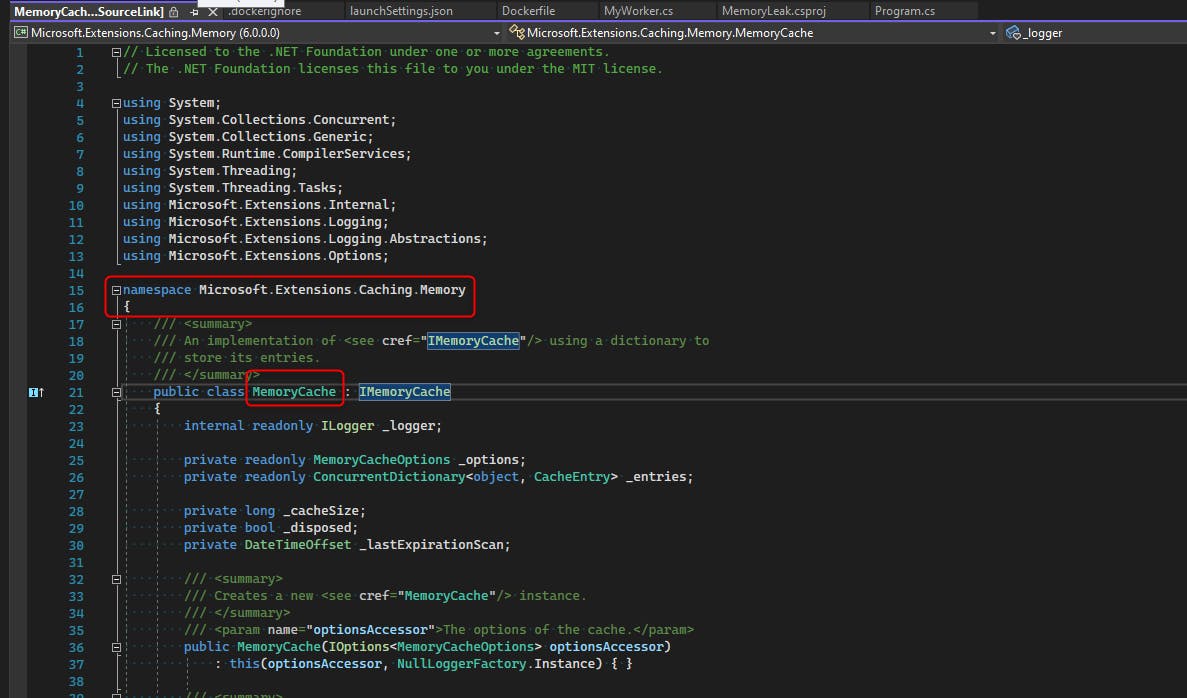
It is the same type returned by PerfViewer !
Now we know we need to fix the memory leak at the property: _memoryCache.
We see this property is only used here:
 protected override async Task ExecuteAsync(CancellationToken stoppingToken)
        {
            while (!stoppingToken.IsCancellationRequested)
            {
                _logger.LogInformation("Worker running at: {time}", DateTimeOffset.Now);
                await Task.Delay(1000, stoppingToken);

                var cacheEntryOptions = new MemoryCacheEntryOptions();

                _memoryCache.Set(Guid.NewGuid(), new byte[10000], cacheEntryOptions);
            }
        }
We can see that our hosted service only adds a new pretty big array of bytes in the memory cache with a guid as a key to find it.
Remember the MemoryCache was injected in our DI by the following code:
using MemoryLeak;
using Microsoft.Extensions.DependencyInjection;
using Microsoft.Extensions.Hosting;

IHost host = Host.CreateDefaultBuilder(args)
    .ConfigureServices(services =>
    {
        services.AddMemoryCache();
        services.AddHostedService<MyWorker>();
    })
    .Build();

await host.RunAsync();
We used the extension method AddMemoryCache to add MemoryCache in the DI. Let's decompile it with VS 2022:
// Licensed to the .NET Foundation under one or more agreements.
// The .NET Foundation licenses this file to you under the MIT license.

using System;
using Microsoft.Extensions.Caching.Distributed;
using Microsoft.Extensions.Caching.Memory;
using Microsoft.Extensions.DependencyInjection.Extensions;

namespace Microsoft.Extensions.DependencyInjection
{
    /// <summary>
    /// Extension methods for setting up memory cache related services in an <see cref="IServiceCollection" />.
    /// </summary>
    public static class MemoryCacheServiceCollectionExtensions
    {
        /// <summary>
        /// Adds a non distributed in memory implementation of <see cref="IMemoryCache"/> to the
        /// <see cref="IServiceCollection" />.
        /// </summary>
        /// <param name="services">The <see cref="IServiceCollection" /> to add services to.</param>
        /// <returns>The <see cref="IServiceCollection"/> so that additional calls can be chained.</returns>
        public static IServiceCollection AddMemoryCache(this IServiceCollection services)
        {
            if (services == null)
            {
                throw new ArgumentNullException(nameof(services));
            }

            services.AddOptions();
            services.TryAdd(ServiceDescriptor.Singleton<IMemoryCache, MemoryCache>());

            return services;
        }

....
We can see IMemory will be returned as MemoryCache as a singleton. So MemoryCache will live all the time the application is alive.
Our application adds items in a static variable : _memoryleak without removing them every second: we have our memory leak!
What can we do to fix it? Well we can remove the item after a while when it is not used for a while, or we can remove it no matter what after an absolute time.
Let's take the second solution:
 protected override async Task ExecuteAsync(CancellationToken stoppingToken)
        {
            while (!stoppingToken.IsCancellationRequested)
            {
                _logger.LogInformation("Worker running at: {time}", DateTimeOffset.Now);
                await Task.Delay(1000, stoppingToken);

                var cacheEntryOptions = new MemoryCacheEntryOptions();

                cacheEntryOptions.SetAbsoluteExpiration(TimeSpan.FromMilliseconds(500));

                _memoryCache.Set(Guid.NewGuid(), new byte[10000], cacheEntryOptions);
            }
        }
We just set the absolute expiration for each item to 500ms, so our newly added item will be removed after 500ms, so before our application adds a new item because we delay 1000ms with the Task.
The memory leak goes away with this simple fix. Remember fixing the memory leak is easier than spotting it most of the time!
Conclusion
I hope this introduction on Memory Leak was useful and that you will be able to fix other Memory Leaks on your production. I just hope it doesn't happen but now you can troubleshoot it!
If you liked my article please help me by subscribing :) Cheers!